
Having written about smart meters and in so doing rediscovering the spend we make on energy, I was struck by the steady rise in our expenditure on communications, which is a similar figure to the spend on energy. Here I have a look at the information on our general spend on that.
I have looked at the accounts for the last four years and three different houses and, not including hardware, we have spent £5015, which makes the average annual spend to the nearest £5 very much the same as the energy costs of the Wallsend period. So it would appear that the spend on communication is a similar number to that spent on energy.
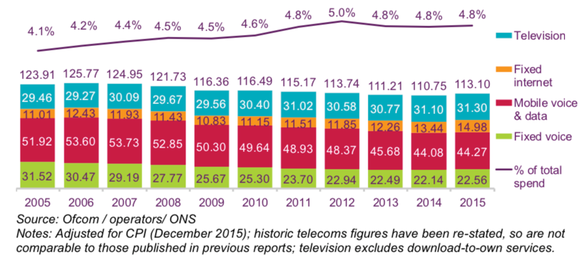
The coloured graph is from Ofcom [1] and shows a typical monthly spend per household on the top of each column, suggesting £1250 to £1500 per year for the period – and these figures are not including capital expenditures (e.g. movies, phones, hardware), nor repairs and maintenance such as upgrades/renewals to software.
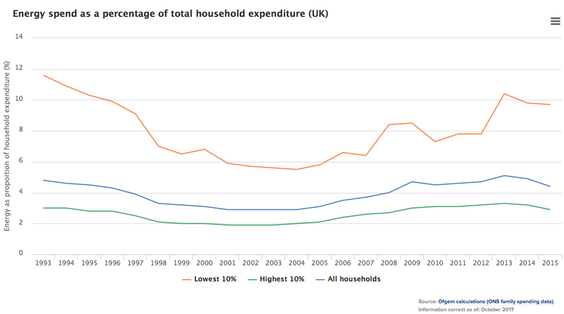
With surprisingly little difficulty I found a similar graph from OfGem, showing that typical energy expenditure (the middle line) was 4.4% in 2015 (lower than comms) but 5.1% in 2013 (higher). You can see the trends in the two graphs, though essay 243 discovered a likely jump in gas price, and therefore total energy costs, expected in 2018.
It looks to me as though calling these two expenditures as similar expenditure per household is a reasonable statement. Note that the lower graph, from OfGem, shows the increased energy costs to low income households.
I found an equivalent graph to the top one for the US, showing greater growth at around 10% per annum from 2006 and 5.5% every year in the previous decade; there are no guarantees these are measuring the same thing, of course.
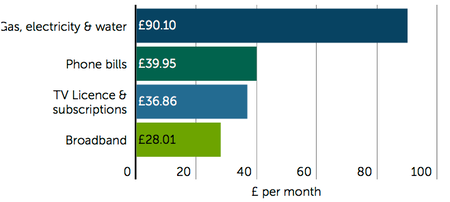
This smaller bar graph is from the Scottish Friendly Society, found on the Money Advice website [4]. Note that these figures put telecomms at adding up to £104.82 compared to £90.10 for energy and water, so more than 15% higher, assuming everyone has all three. The linked site points to things you might do to reduce these bills.
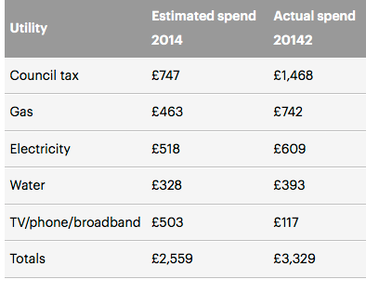
Santander did a similar study (the grey table) which disagrees markedly. The reaction suggests that £117 (for comms) should be £1170. Their report—the one I found—uses the term household bills to include Council Tax, TV, phone, broadband, gas, water and electricity. Rent and mortgage payments were excluded from the analysis.
DJS 20180120
Me-me-me context:
Back in Wallsend, for which I have complete figures because I ‘did’ the accounts for the period, we used annually just under 3700kWh of electricity and between 8500 and 11500 kWh of gas. The electricity dropped off quickly when the PV solar installation kicked in, so that the next year looked as though we would use under 1300kWh from the grid; call that a third of the previous figure. See essay 218. The end figures also dropped as occupancy fell. Annual energy cost about £1250, dropping rapidly to £800.
Meanwhile communications costs ran at £1125 before we include repairs or replacements, so a very similar number.
For the Stockport period we had no tv licence and used P-net since Virgin was not available, and so we had in consequence a much reduced comms demand, totalling £550 (yes, half as much as before) before we include repairs and replacements. Software support for the hardware runs at around £200 per year. Meanwhile, fuel worked out at 1650kWh of electricity and 5950kWh of gas, per year. DJS: insert the Money values here
For the Blackpool period we are running the tv on FreeSat and using P-net (still no Virgin), and we seem to be using around £650 per year. Fuel bills—and this house is COLD so far—suggest we will use 2000 kWh of Elecy and 9000 kWh of Gas in the year. That’s before my insulation programme kicks in. That’s also a lot of heating to very little effect. DJS: insert the Money values here
Reversing the measurement and looking at total expenditure, I have:
2014 £1950, 2015 £1360, 2016 £670 (or £3400 with the IT purchases), 2017 £1030, which suggests an average running cost for tv, phones and computers of £1250, not including the latest hardware purchase.
[1] https://www.ofcom.org.uk/__data/assets/pdf_file/0028/98605/Pricing-report-2017.pdf well worth a proper read.
[2] https://www.ofgem.gov.uk/data-portal/energy-spend-percentage-total-household-expenditure-uk
[3] https://www.ons.gov.uk/peoplepopulationandcommunity/personalandhouseholdfinances/expenditure/bulletins/familyspendingintheuk/financialyearending2017
[4] https://www.moneyadviceservice.org.uk/blog/how-much-do-you-spend-on-your-household-bills
[5] http://www.thisismoney.co.uk/money/bills/article-2834909/Do-know-spend-bills-Households-underestimate-yearly-spend-utilities-council-tax-770.html
[6] https://www.santander.co.uk/uk/infodetail?p_p_id=W000_hidden_WAR_W000_hiddenportlet&p_p_lifecycle=1&p_p_state=normal&p_p_mode=view&p_p_col_id=column-2&p_p_col_pos=1&p_p_col_count=3&_W000_hidden_WAR_W000_hiddenportlet_javax.portlet.action=hiddenAction&_W000_hidden_WAR_W000_hiddenportlet_base.portlet.view=ILBDInitialView&_W000_hidden_WAR_W000_hiddenportlet_cid=1324583259913&_W000_hidden_WAR_W000_hiddenportlet_tipo=SANContent
Tip: if you are worried about internet security, have a look at setting your DNS at 9.9.9.9. Look for Quad9 on the ‘net. Site. Free.