
Discovery: that parkrun age-grading is based on a single figure per age.
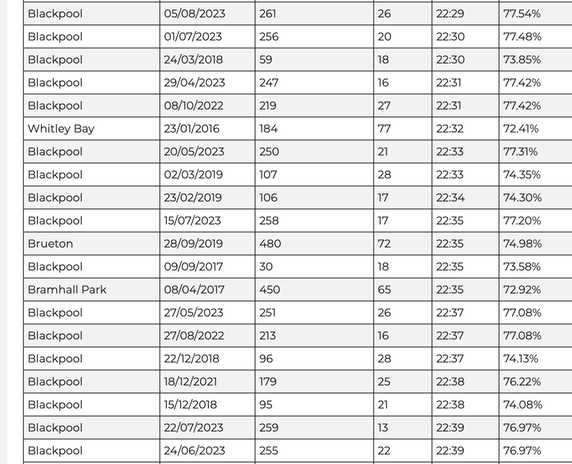
The collection of details to the right is an extract of parkrun times for me in finish time order. Age grading shows in the last column; the bottom two lines show the same time, 22:39, and same percentage, 76.97%, one month apart. Higher up there are adjacent rows with 77.08% and 22:37, nine months apart and, near the top, two at 22:31 and 77.42%, six months apart. My conclusion here is that, whatever figures are used to calculate age grading, they are fixed for the whole of the year that the system recognises you as being that age. I do not guarantee it gets the date of age change immediately correct. I think the system may only be using your birth month.
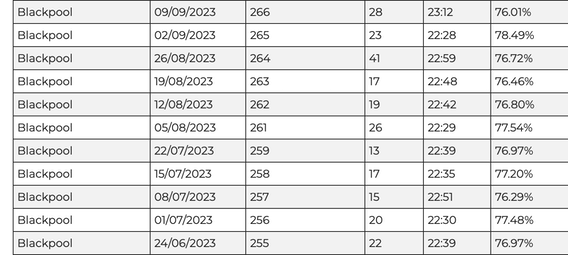
Next, justified to the left, are my most recent results in date order, with an age-category change at the end of August. Please look at 2nd September (event #265, 22:28, 78.49%) and 5th August (event #261, 22:29, 77.54%). One second different and, effectively, a whole 1% change, 0.95% in this example. Events #259 and #261 show that ten seconds is 0.57% difference, so one second is about 0.06%, which leaves most of 0.9% of the 1% difference across a birthday only explained by that age change. I'm using 1% a year as my rough rule for decay with age. The upper of these tables shows events #59 and #256, equal times of 22:30, five years difference (five birthdays different) and 3.63%, 0.73% a year if decay is constant, which it is not at my age. Age-grading is calculated on the world record at any particular age, smoothed a little to remove outliers; the decay around my age is not linear nearer 0.5% per year at 65 and increasing by 0.1% each year to 0.9% at 69.
Now I direct your attention to the top two lines of the second table, runs #265 and #266, with 44 seconds change and 2.48% change; this implies that each second is between .05 and .06% difference in age-grading, that 18 seconds is a whole one percent. Having run relatively quickly (for me) in run #265 I was hoping for similar things in run #266.
The day was hot, 25º at 09:00 and humid, so that sweat didn't cool one much at all. I was pretty disgusted with my time and was blaming the weather rather than taking responsibility for a bad night's sleep.
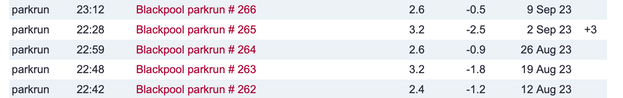
So I went to look at the SSS scores, expecting them to show that #266 was declared to be somehow harder. To my surprise, the SSS went down from 3.2 to 2.6, (see right) declaring #266 to be easier. My time for #266 was the slowest since #236; run #240 was the last time I was over 23 minutes, so #266 classes as Bad or Slow. Now, SSS scores are based on the behaviour of those who run on the day compared with their average performance; there were quite a few of the regulars off to Tyneside for the Great North Run and there were several other races on that day, but SSS depends on comparing who attends with how they usually run, so it doesn't matter who wasn't there. Which menas that the consensus result says that, despite the heat and humidity, this was a good day for running. Repeating, the general trend was 'better than usual', which makes the wife and I in the contrary group. In turn that means, probably, that it was the late night that did the damage, not the weather.
So I'm looking for an improvement in run #267, as is the missus. We were both 45 seconds down on what I'd call the 'hopeful' time rather than an 'expected' one.
You can look this stuff up yourself very easily. Find a parkrun results page, pick on a runner (most people will look at themselves) and click on the runner's name. This gets you (pretty immediately) to results for just that runner. Options just above the tabulated results include choices of all results or summary results. Most tables from parkrun are sortable in every column, so you can fiddle very easily. For example, my fastest parkrun was at Whitley Bay, seven and a half years ago, but still one of my very best on age-grading, with Blackpool #265 right next to it; I only have ten times been given 78% and they're in three year pairs, 2014/5, 2017/8 and 2022/3. My mean is 75%; I discount the two slowest times 35:13 and 25:57 because I walked those and that fast walk beats several poor days on a hilly course in Stockport. So, for me, a bad day is under 71% and a good day is over 77% - suggesting a median performance of 74%, against a mean of 75%. Yes, you're right I could graph these for a distribution.
DJS 20230913
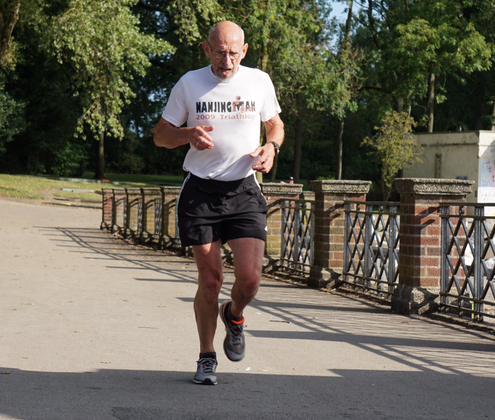
top pic: me doing parkrun, in an empty space, so I'd assume this is in the last kilometre.
_________________________